

Know what’s really happening behind the till.
Cambium connects to your card machine and turns every sale, refund and payout into live revenue trends, next-month forecasts and product-level insight — the view big retailers pay analysts for, without the spreadsheets.
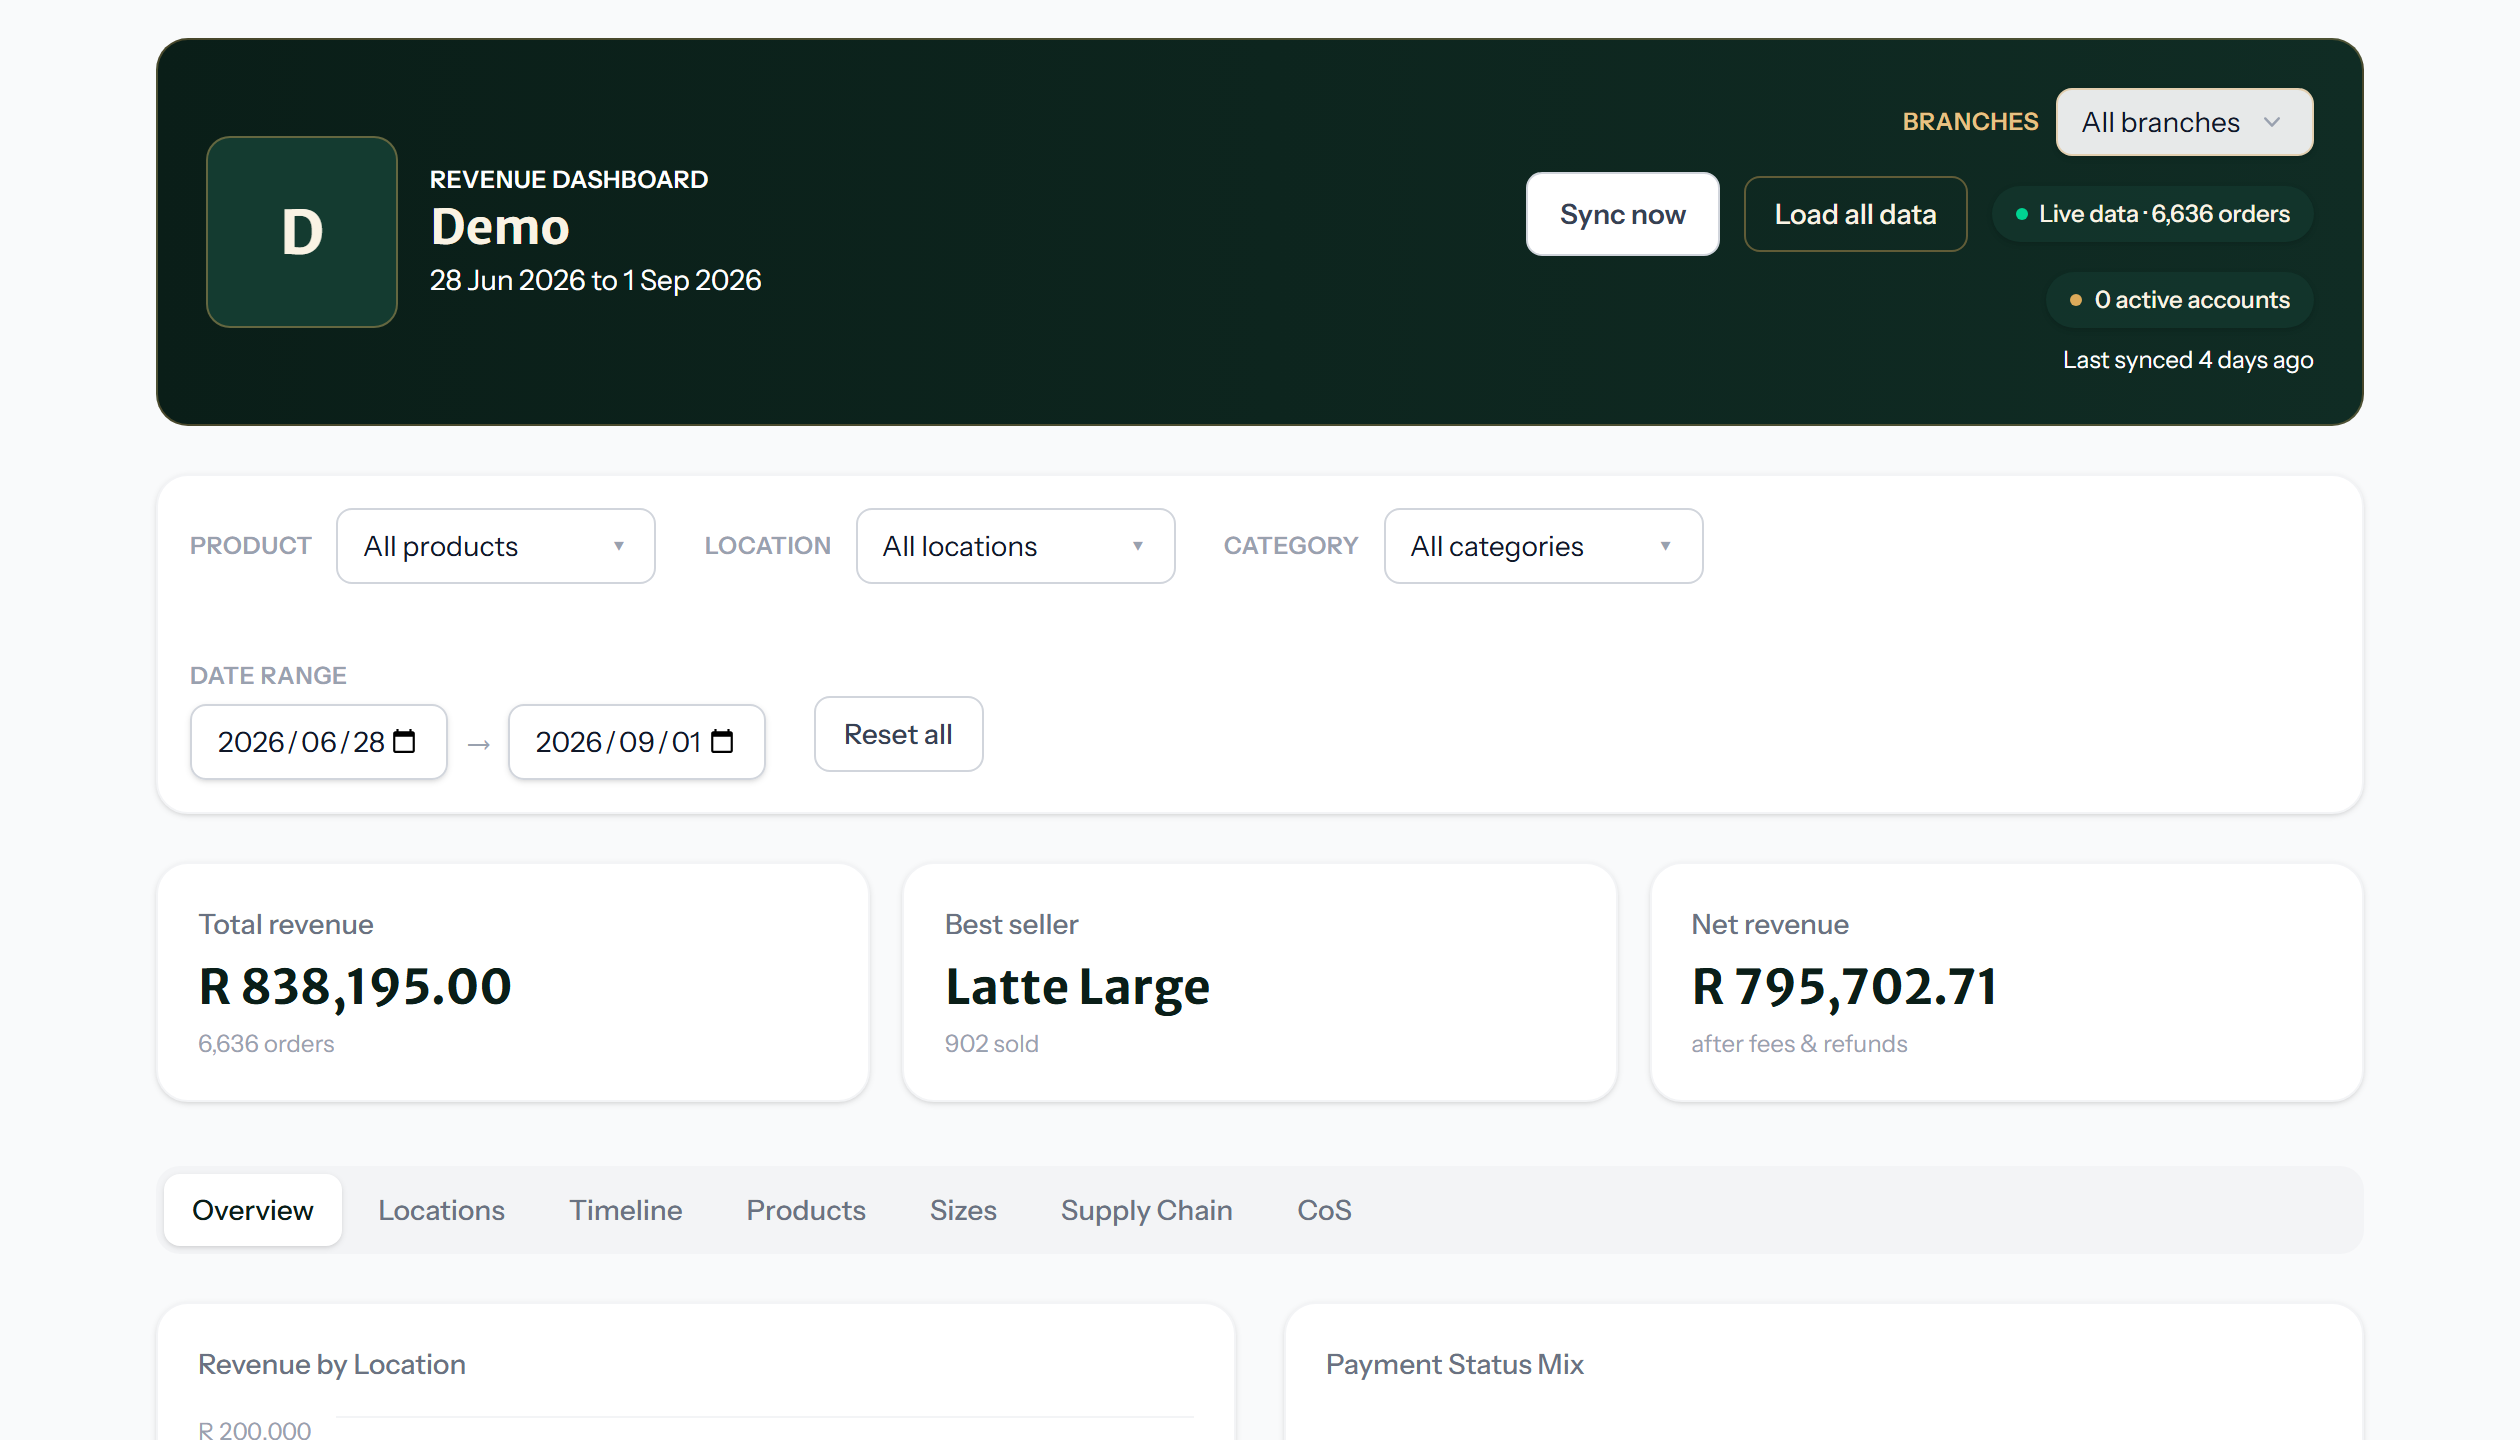
Watch revenue move — and see where it’s heading
Revenue by day, week, month or season, with the month-over-month swing called out. Cambium builds a forecast for next week and next month from your own trend and seasonality, so a slow patch is something you saw coming.
- Actual and predicted revenue on one timeline
- Filter any view by product, category or location
- No setup — it starts the moment your sales sync
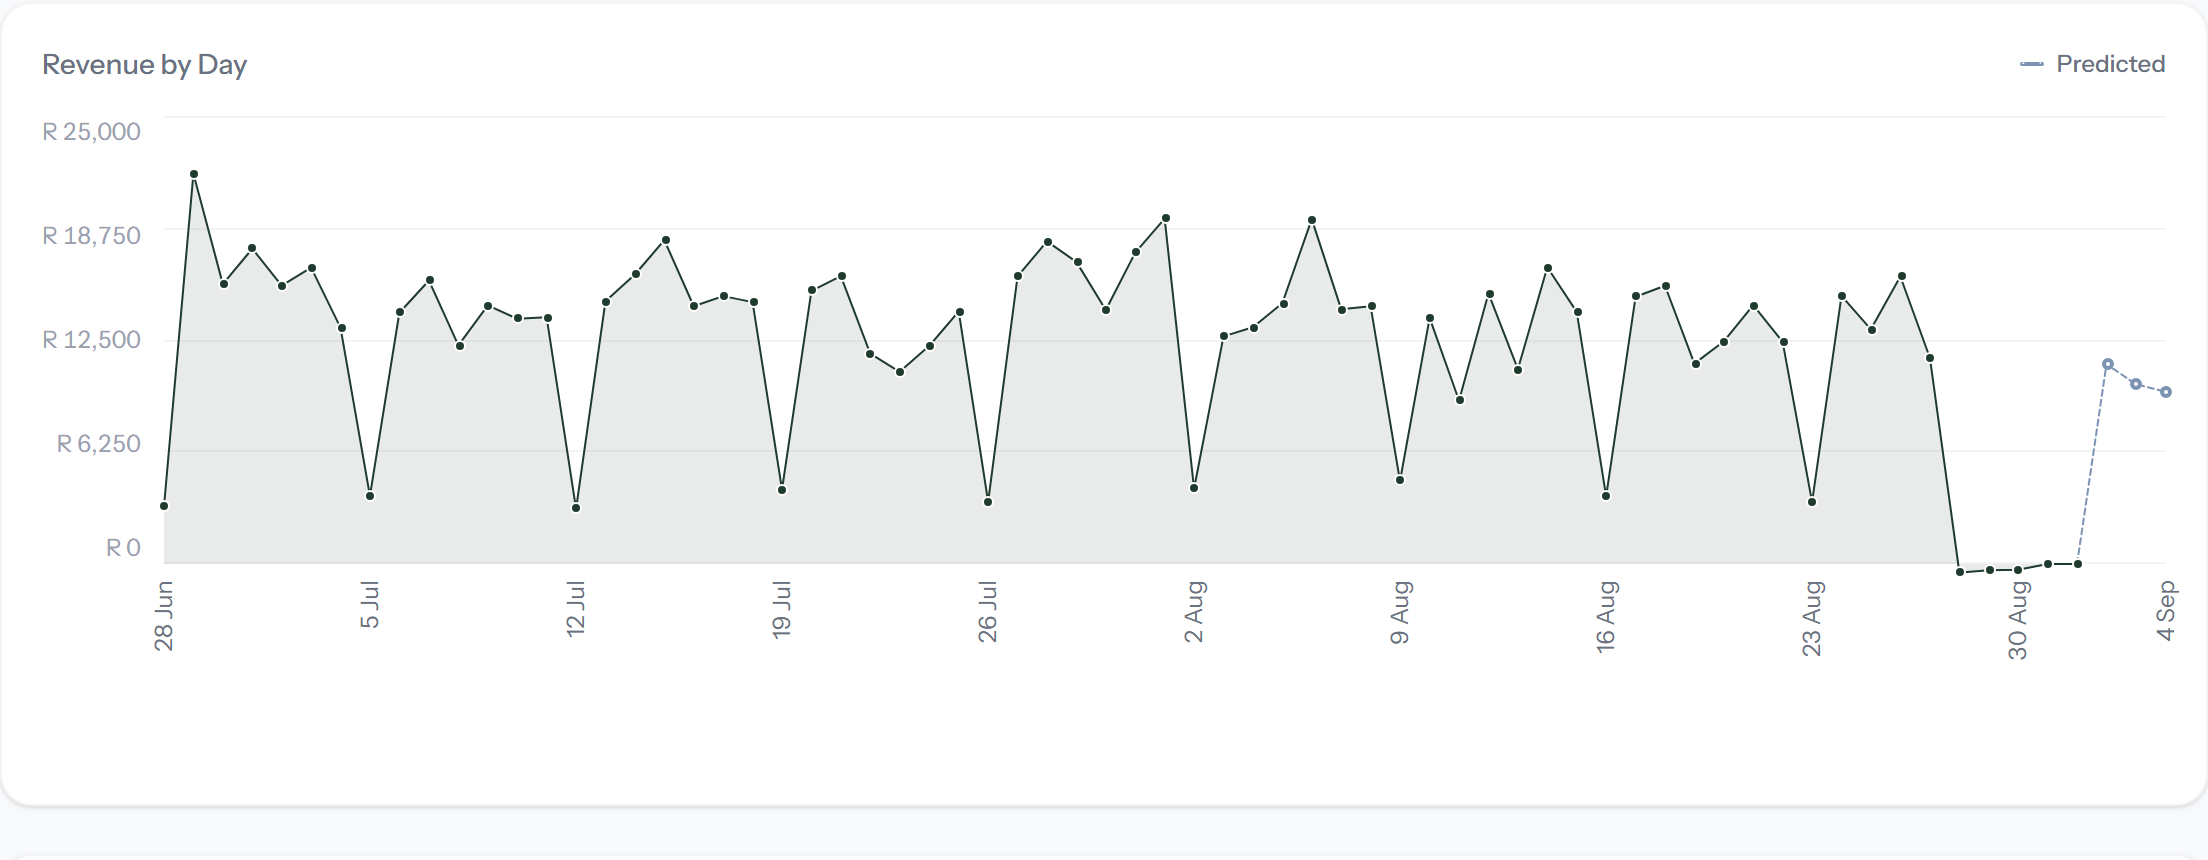
Your best and worst sellers, ranked
Every item ordered by revenue and by units, split by the location that sold it. Push the winners, cut the dead stock, and stop guessing which lines actually pay their way.
- Top and bottom movers for each branch
- Revenue split by category and size
- “Never sold” list for catalogue clean-up
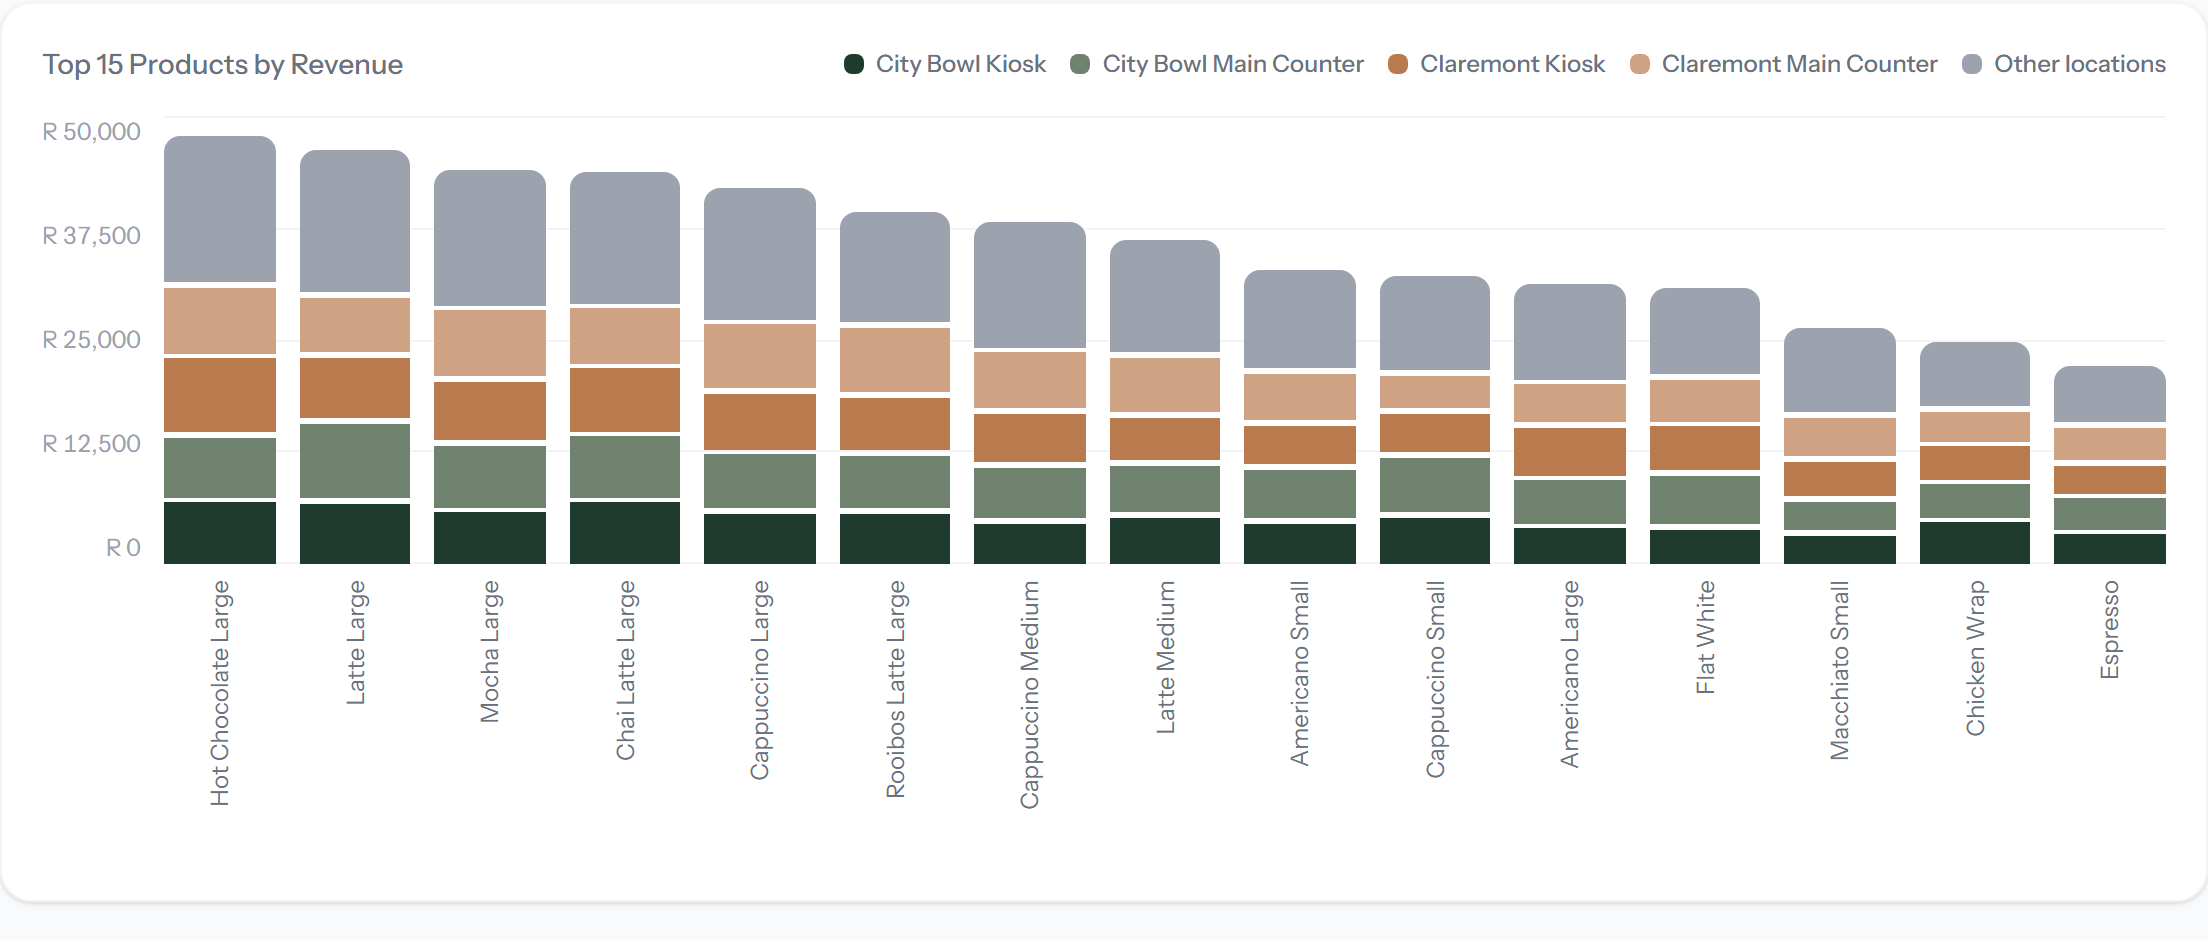
Every angle on your sales, in one place
Slice the same numbers however the question comes up — by site, by product, by person, by margin.
By location
Compare branches and counters side by side and spot the site carrying the month.
By product & category
Every item ranked by revenue and units. Coffee versus food, Grande versus Tall.
By staff
See who’s ringing up the most, and when your genuinely busy hours are.
Forecasts
Next week and next month, from your own trend and seasonality — not a guess.
Cost of sales
Load recipes and costs to see margin per product, not just top-line revenue.
Live & automatic
Connect once. Cambium keeps pulling new sales in the background, on its own.
The detail is already there when you need it
Best and least sellers for every location, side by side, for the period you’re looking at.
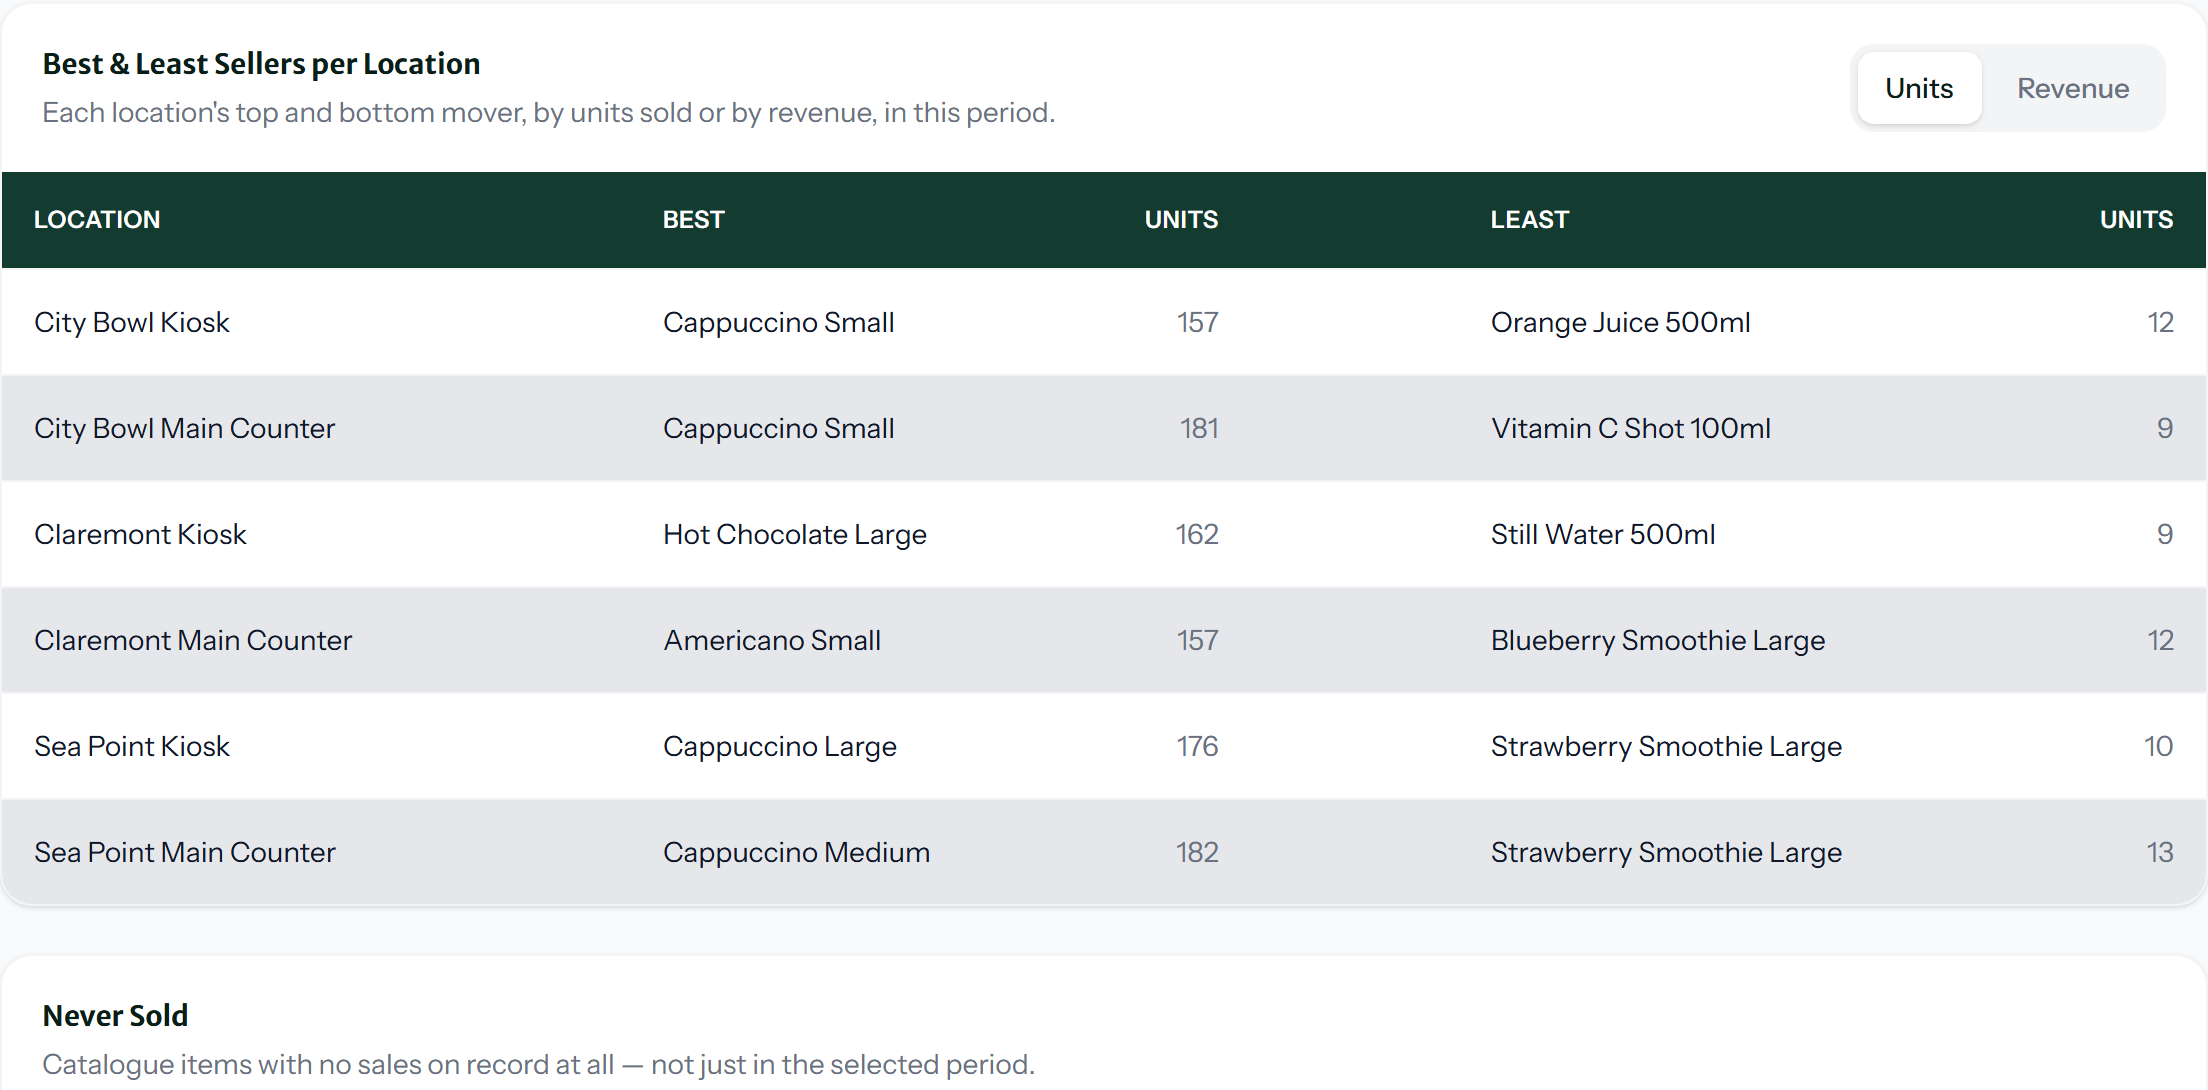
Live view from a demo coffee business running on Cambium.
Built for small business owners
A shop, café, salon, studio, food truck or market stall — anyone who takes card payments and wants to know what’s really going on without living in spreadsheets. No accountant required, no POS lock-in.
Ready to see your own numbers?
Send us a note and we’ll set up a walkthrough on data that looks like yours.